Event statistics
From Events, open an event and select the Statistics tab. All numbers are scoped to the event date you pick in the header. Multi-day events have one row of stats per day; switch the date to compare nights or matinees.
The tab aggregates scans for that date, shows high-level KPIs, and when the venue is active adds a live snapshot of throughput. You also get scan outcomes, ticket type performance (with optional source filter), validator performance, and a validation timeline. This complements scanning at the door: phones record entries; the dashboard is where you monitor progress and spot issues.
Status, refresh, and time zone
The top of the page shows whether the selected date is considered live (within the event window), when activity last occurred, and how many validators are active. Use Refresh to pull the latest figures; the page can also refresh automatically while you stay on it during a live show.
Times (for example peak scan time) use the event location time zone, consistent with the rest of the manager app.
Preview

Live event snapshot
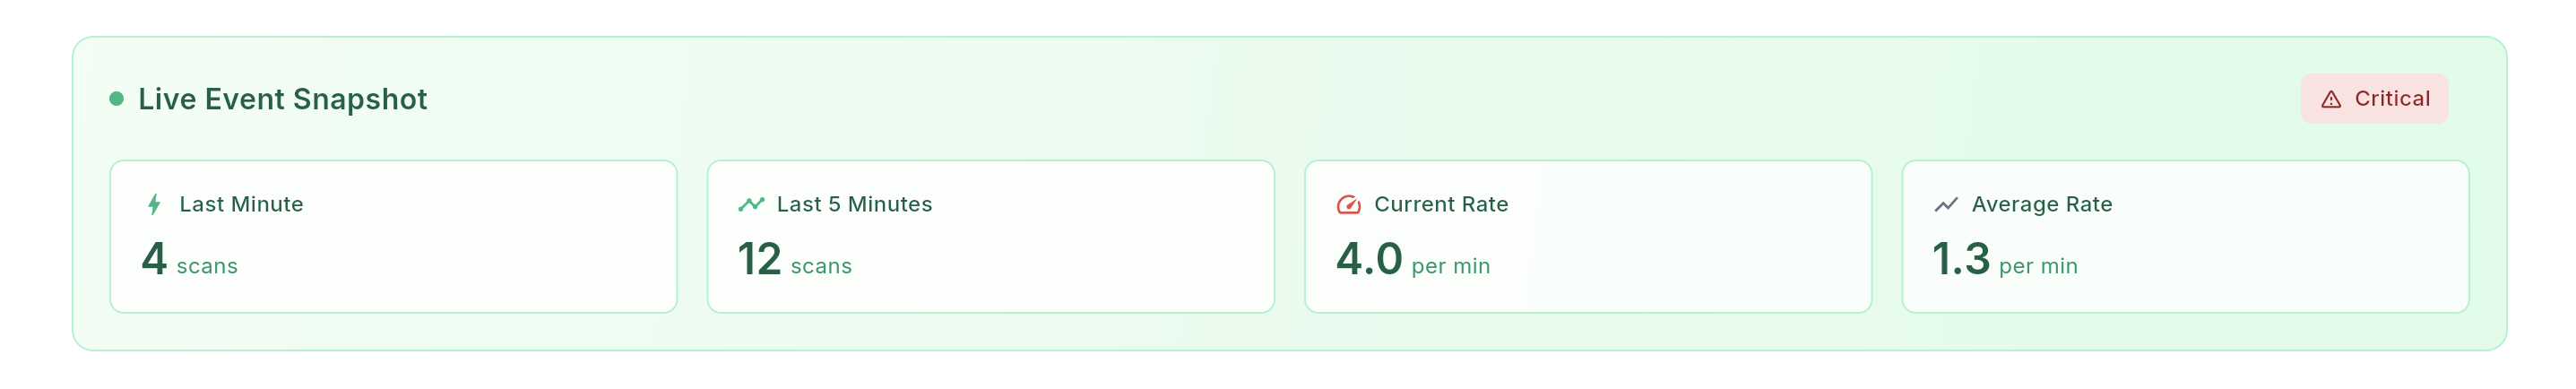
While the selected date is live, a green Live Event Snapshot section appears. It highlights recent throughput and pressure:
- Last minute and last 5 minutes: how many scans happened in those windows.
- Current rate versus average rate (per minute): helps you see if queues are heating up compared to the night so far.
- Indicators for queue pressure, pending sync (when offline-capable devices have data to upload), and warnings if validators are offline or scans have paused.
Tip: If the live strip flags inactivity or offline devices, coordinate with staff on the ground before assuming the system is wrong.
Preview
Engagement, ticketing, and operations
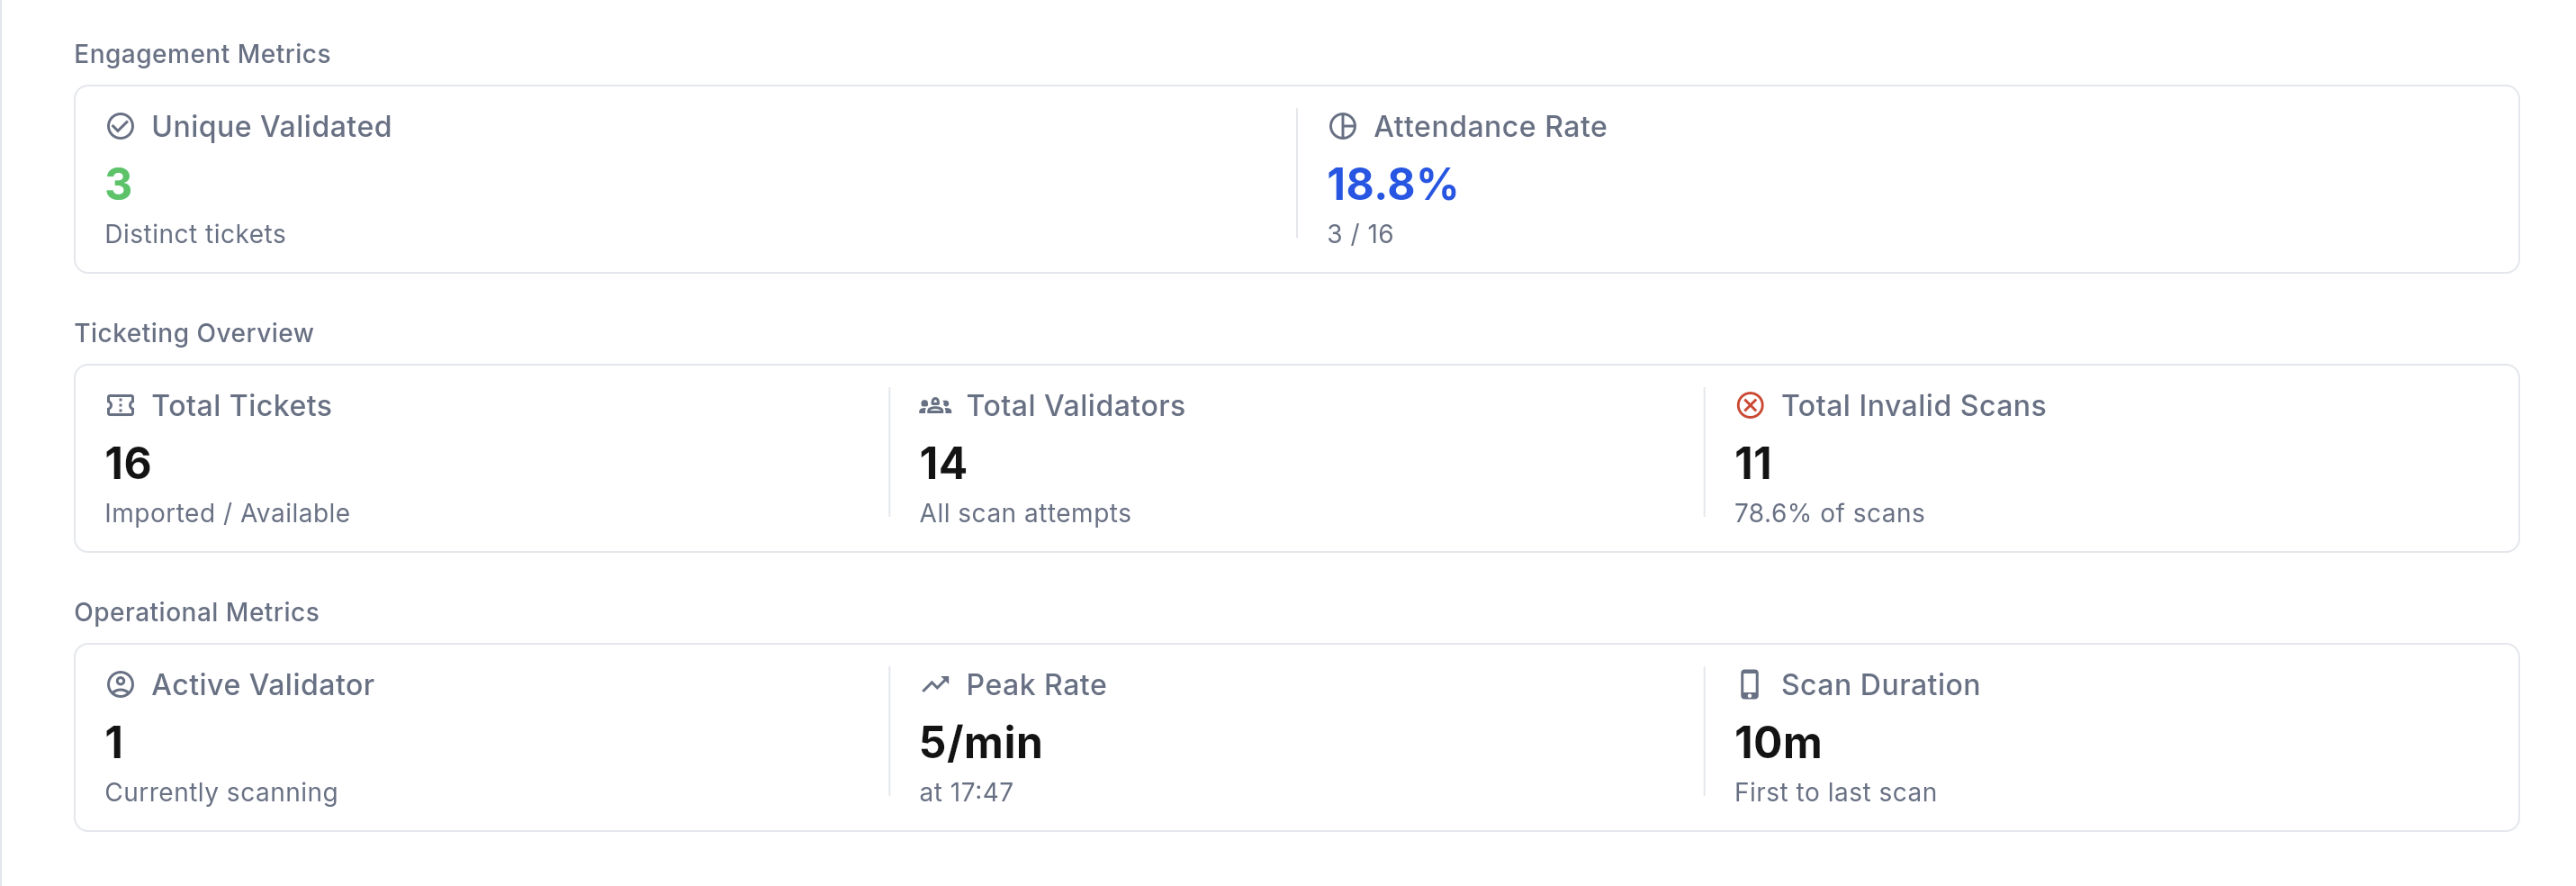
Below the header, grouped cards summarize the day:
- Engagement metrics: Unique validated (distinct tickets successfully scanned) and Attendance rate (share of imported tickets that have checked in).
- Ticketing overview: Total tickets imported, total scan attempts across all validators (including repeat scans), and Invalid scans with what share of attempts failed.
- Operational metrics: how many validators are active, Peak rate (maximum scans per minute and when it happened), and Scan duration from first to last scan on that date.
Preview
Timeline and ticket type performance
The validation timeline charts scan activity over the selected date. You can narrow the chart by bucket size, ticket source, ticket type, and result so you can focus on a window or a subset of sales.
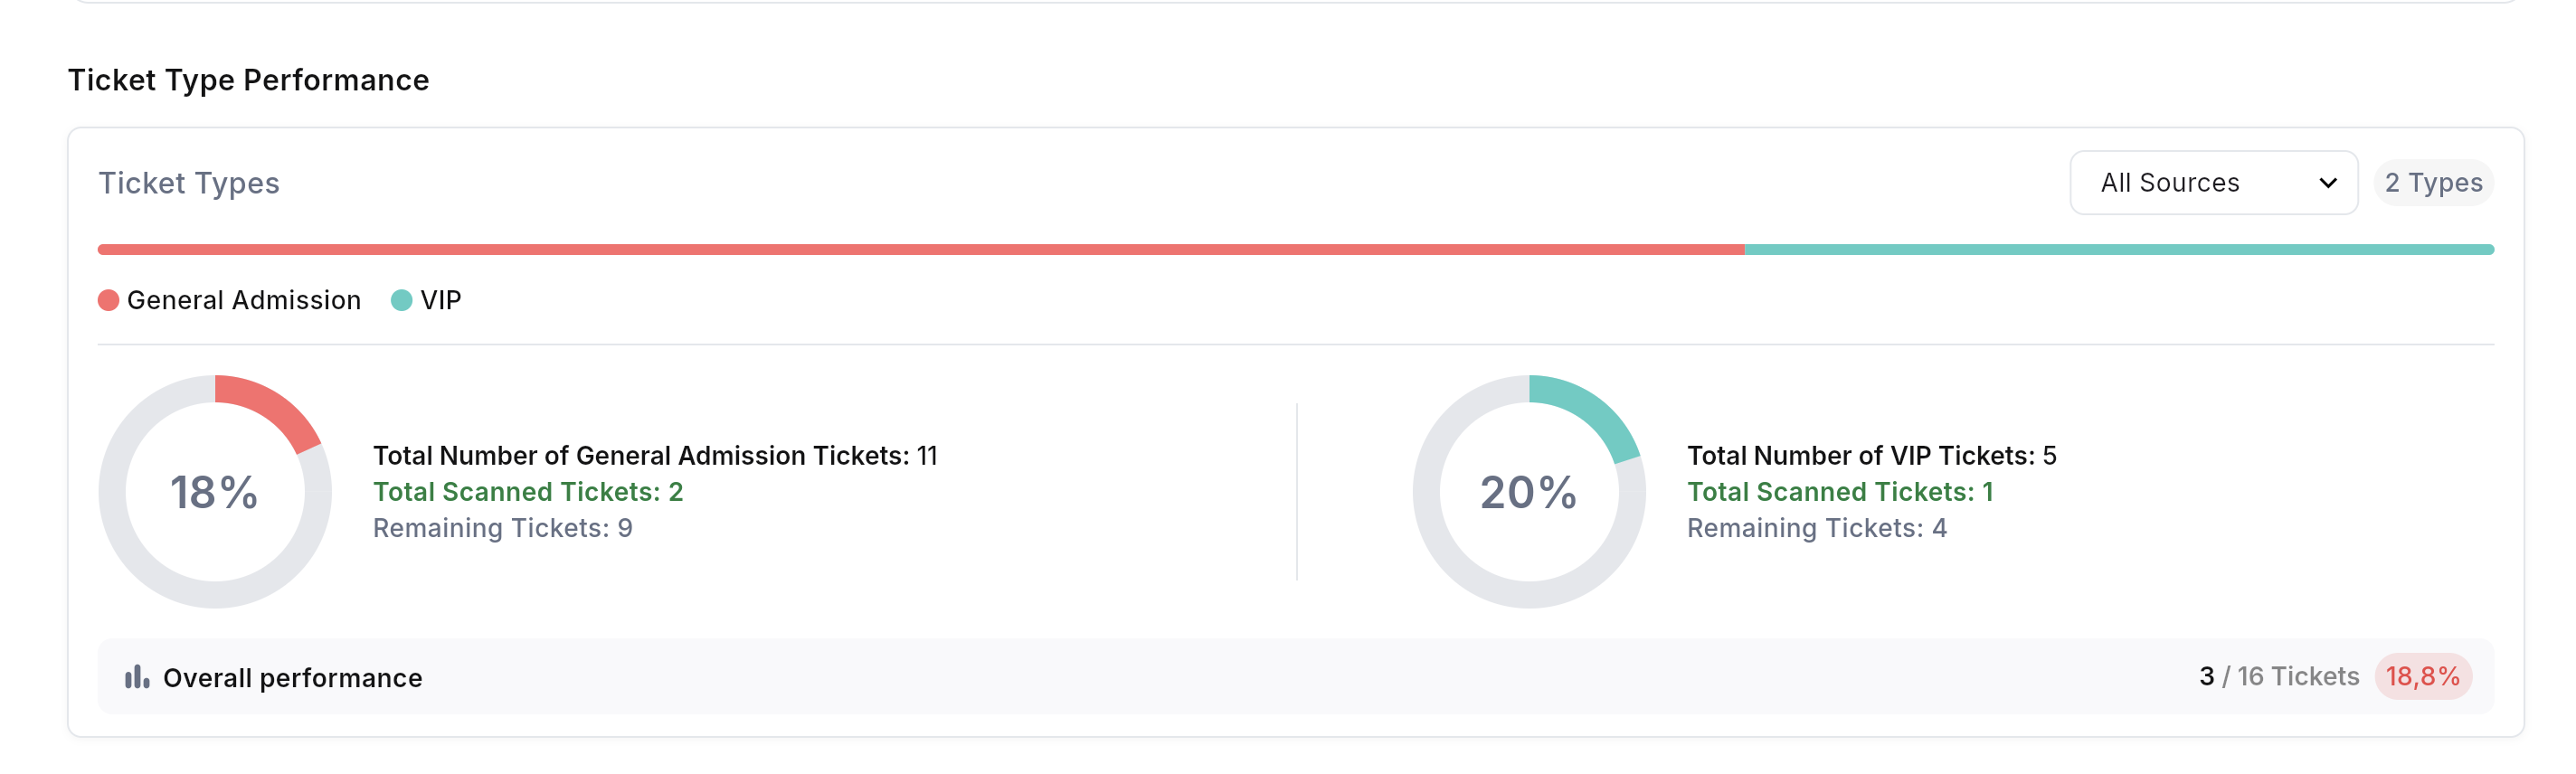
Ticket Type Performance follows: see how entries land across tiers. Where it applies, filter by ticket source to compare channels (for example presale versus door). See multiple platforms if you sell across several systems.
Preview
Scan outcomes, validators, and logs
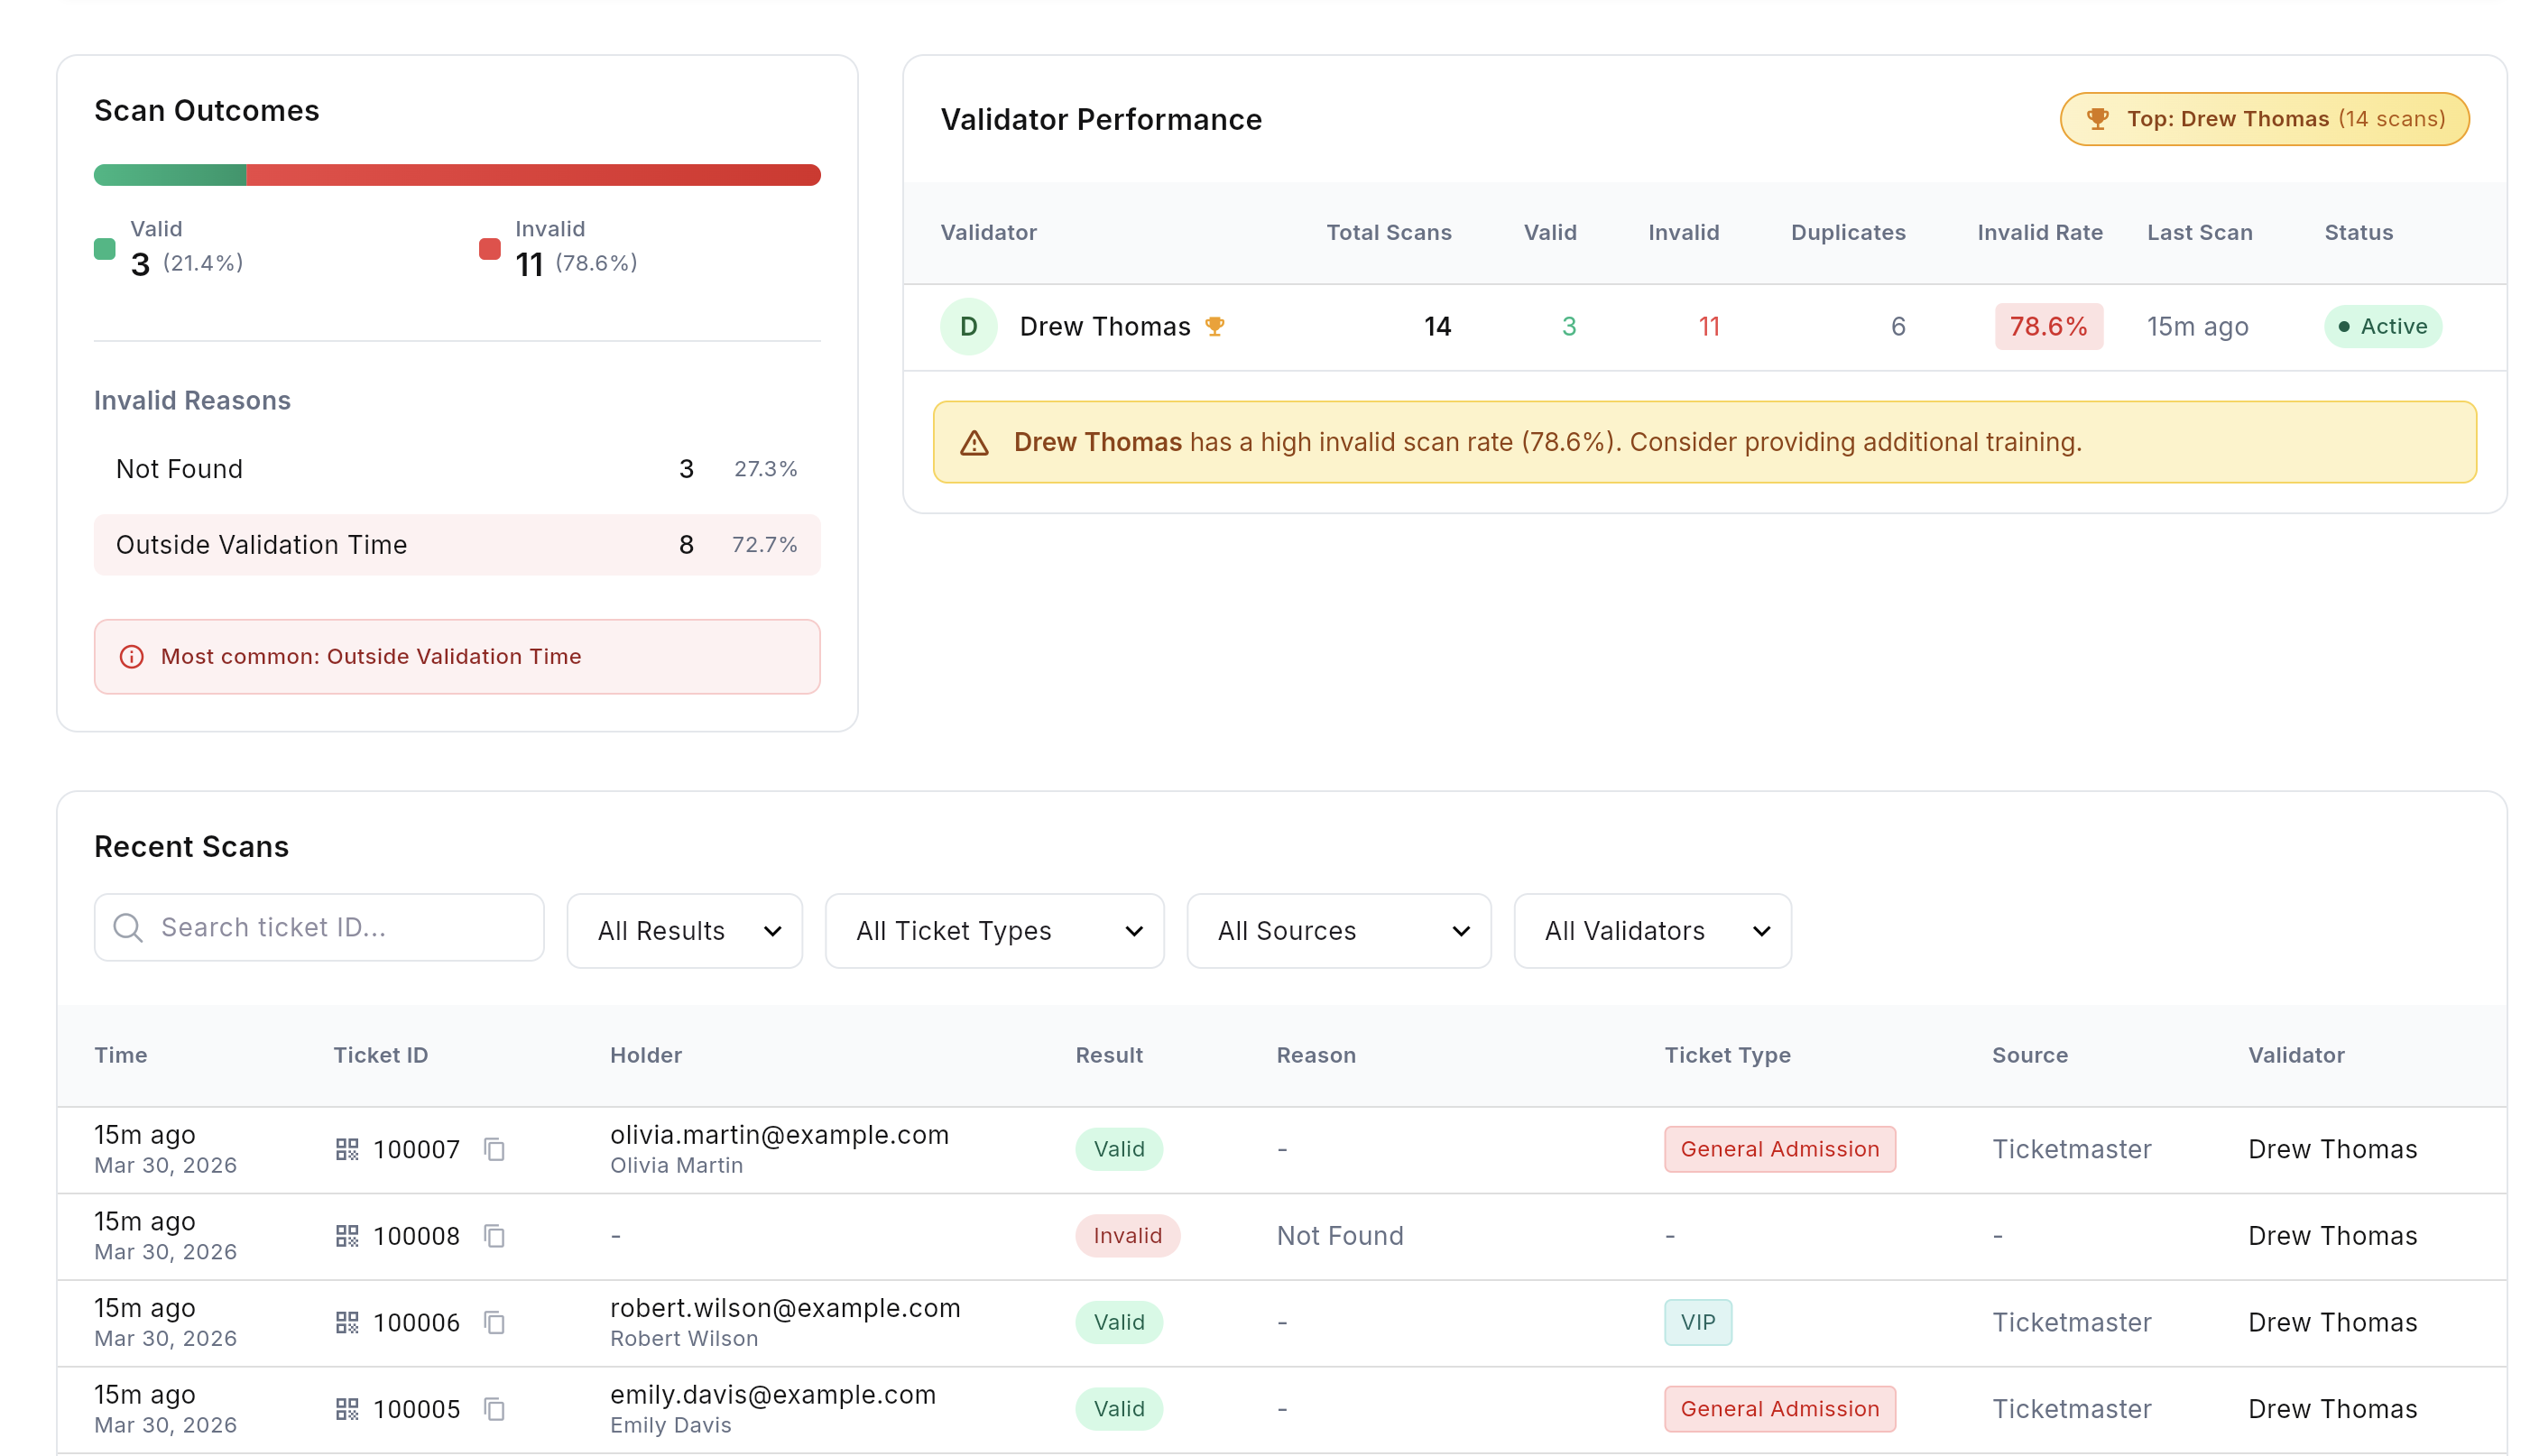
Scan outcomes summarizes valid versus invalid attempts. When data is available, invalid reasons are broken out so you can spot recurring issues (wrong night, already used, and similar).
The validator performance table compares validator accounts for the selected date (volumes and timing). It helps balance teams across entrances or review performance after the show.
At the bottom of the tab, paginated validation logs list individual scan records for the event date, with filters you can adjust to investigate specific cases.
Preview
- Empty or stale numbers: confirm you selected the correct event date and press Refresh once scanners are active.
- Counts do not match expectations: remember Total validations counts attempts; Unique validated counts distinct tickets. Re-imports and duplicate scans affect the two differently.
- Live strip missing: the snapshot appears when the selected date is within the live window; outside that you still see historical KPIs for that day.
Full picture from the office
Statistics are read-only monitoring: changing validation rules or assignments still happens under event setup and validation rules. For field operation, keep the mobile app guide handy for your team.