How to use AI Insights on an event
On each event in the web app, the Insights tab offers AI-powered analysis for a single event date. Generate a briefing, then ask follow-up questions about that night.
The generated report is oriented around unusual signals (passbacks, reject spikes, validator outliers, POS oddities, and similar), rather than restating the KPI cards you already see under Statistics. In follow-up chat, you can still ask about attendance, rates, validators, timelines, or anything else about that event date.
Administrators (and system admins) can generate analyses and ask follow-ups.
Viewers see the Insights tab but get a locked message: AI Insights is available to administrators. They should ask an admin to share findings if needed.
Insights runs in the web manager app only. It is not part of the manager mobile shell.
Open Insights and generate
Go to Events, open the event you care about, and select Insights (AI-powered event analysis).
Pick the correct event date in the date selector. Multi-day events are analysed one day at a time.
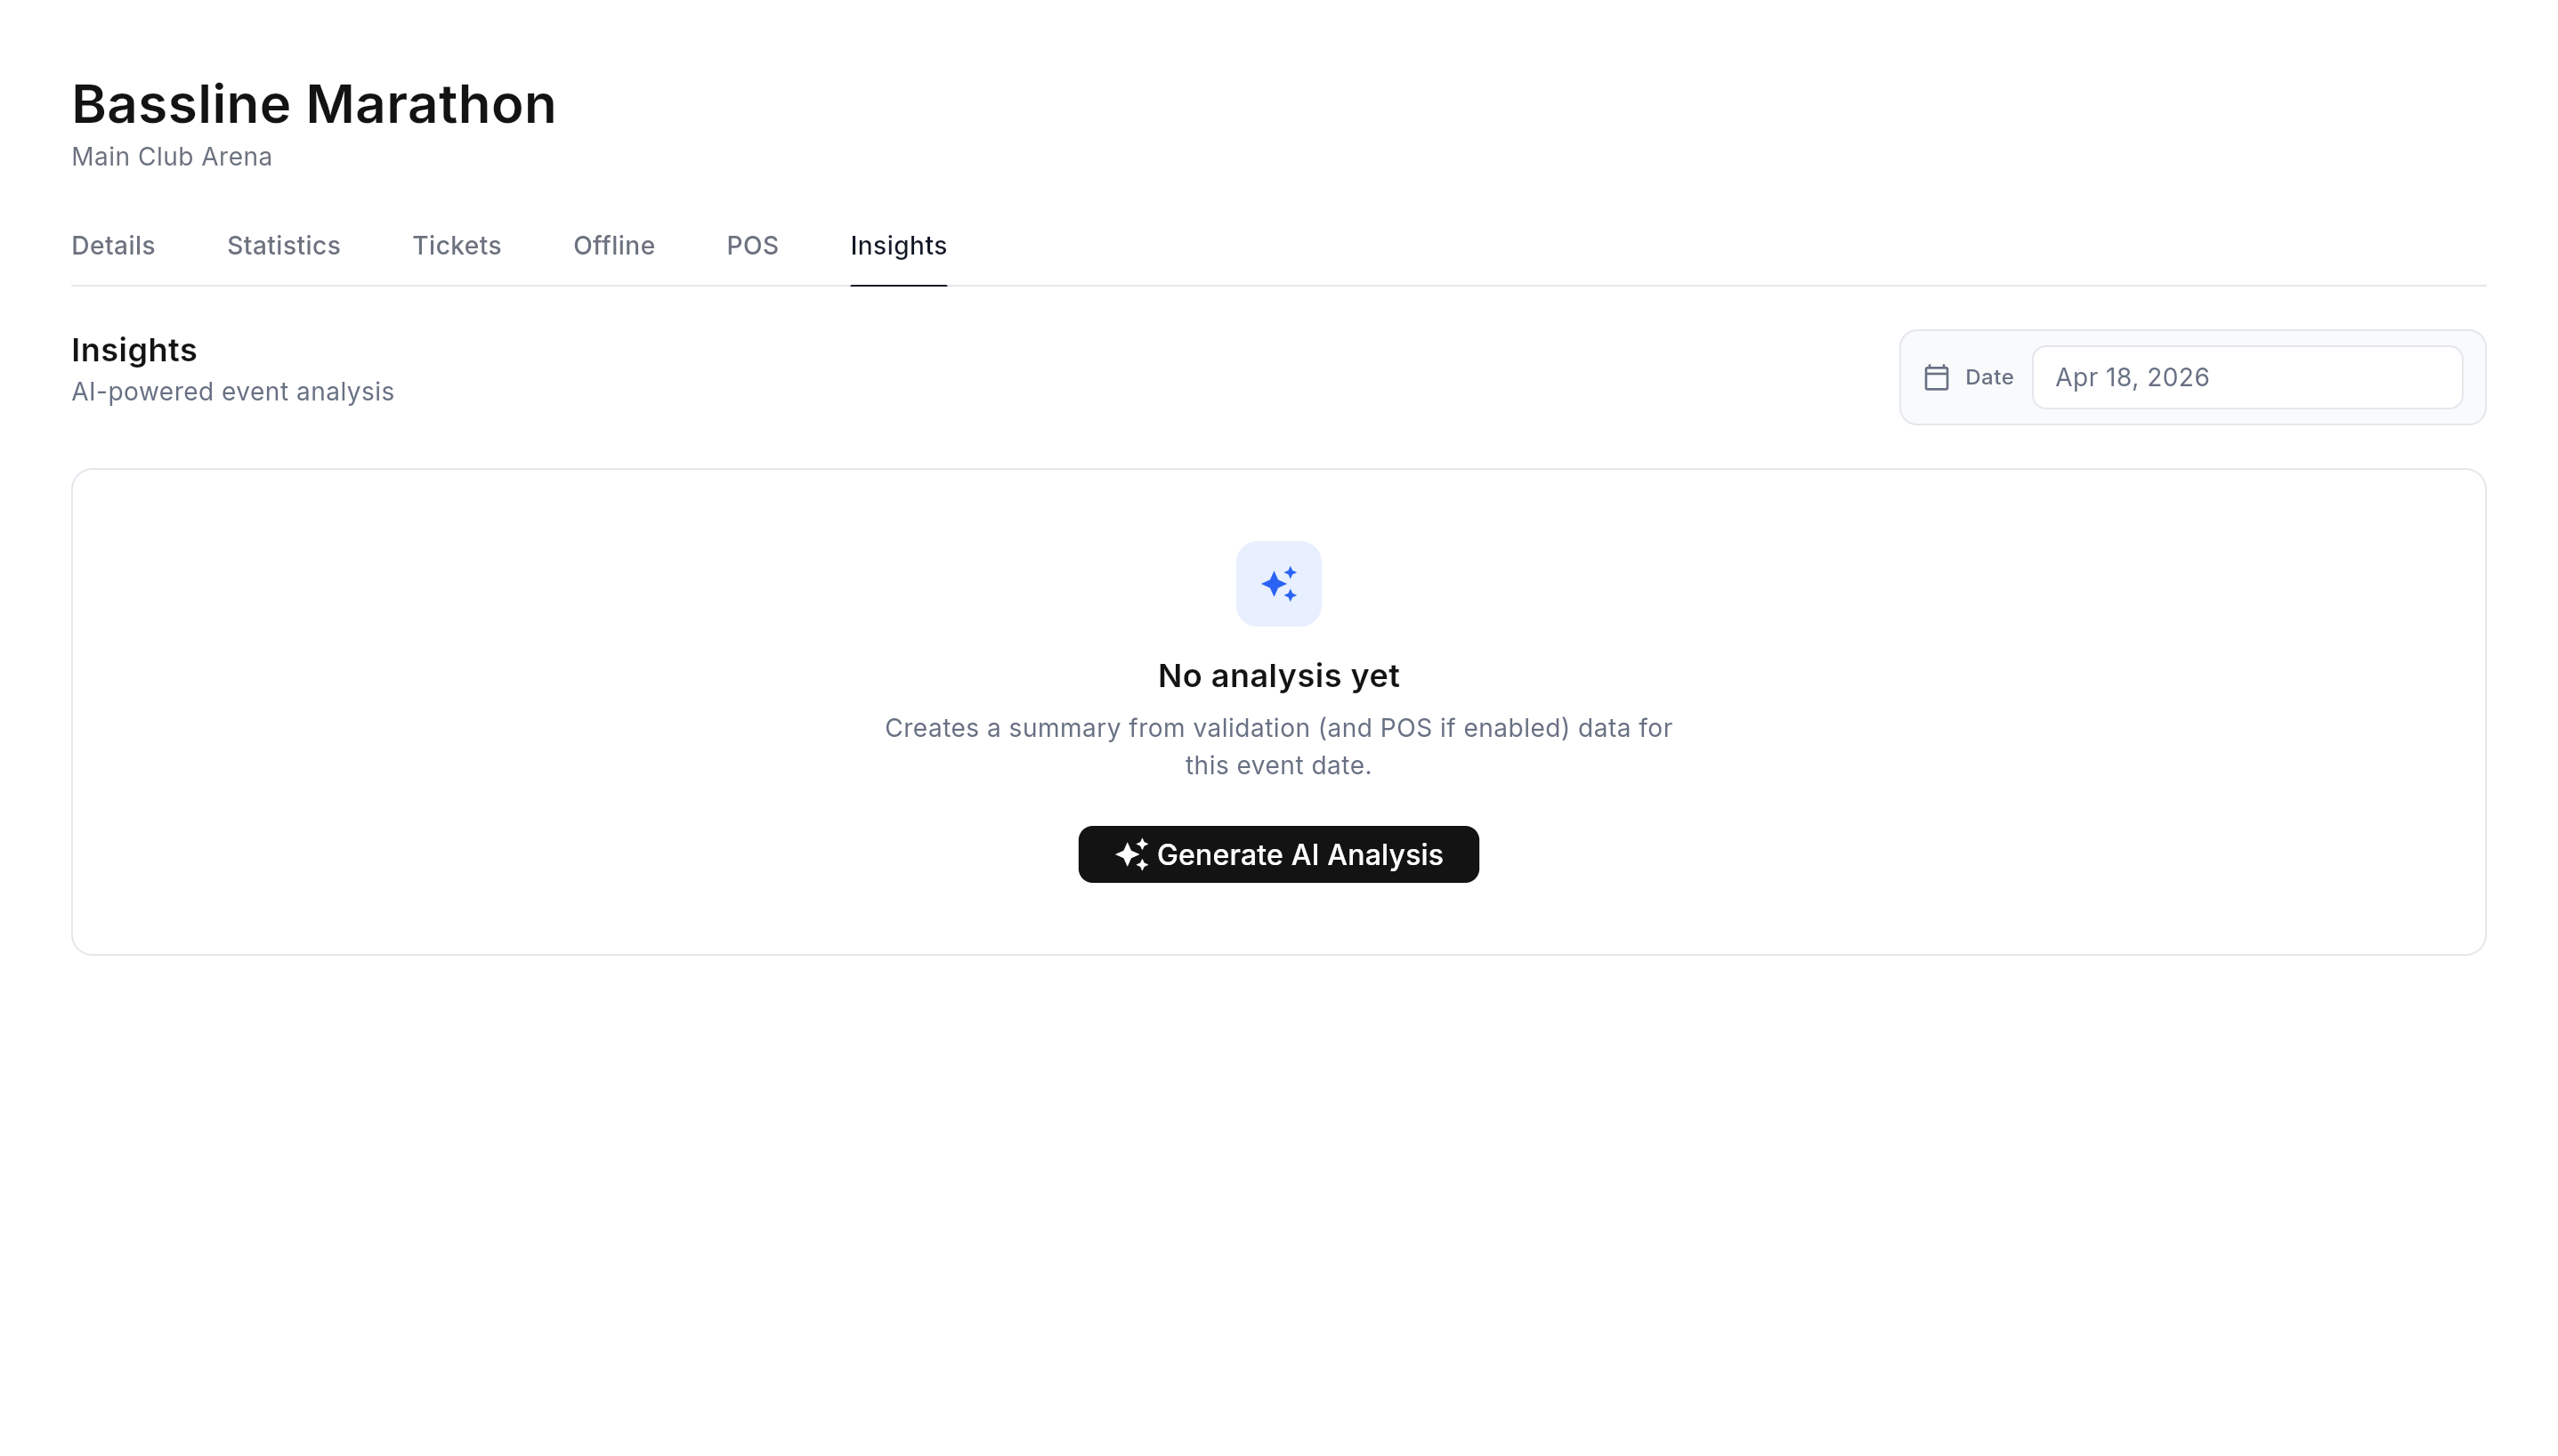
When nothing exists for that date yet, you see No analysis yet. Click Generate AI Analysis to start. The summary is built from validation data (and POS data when POS is enabled).
Tip: Insights is most useful after there is real scan activity for that date. An empty night will produce a thin or all-clear briefing.
Preview
Wait while it analyses
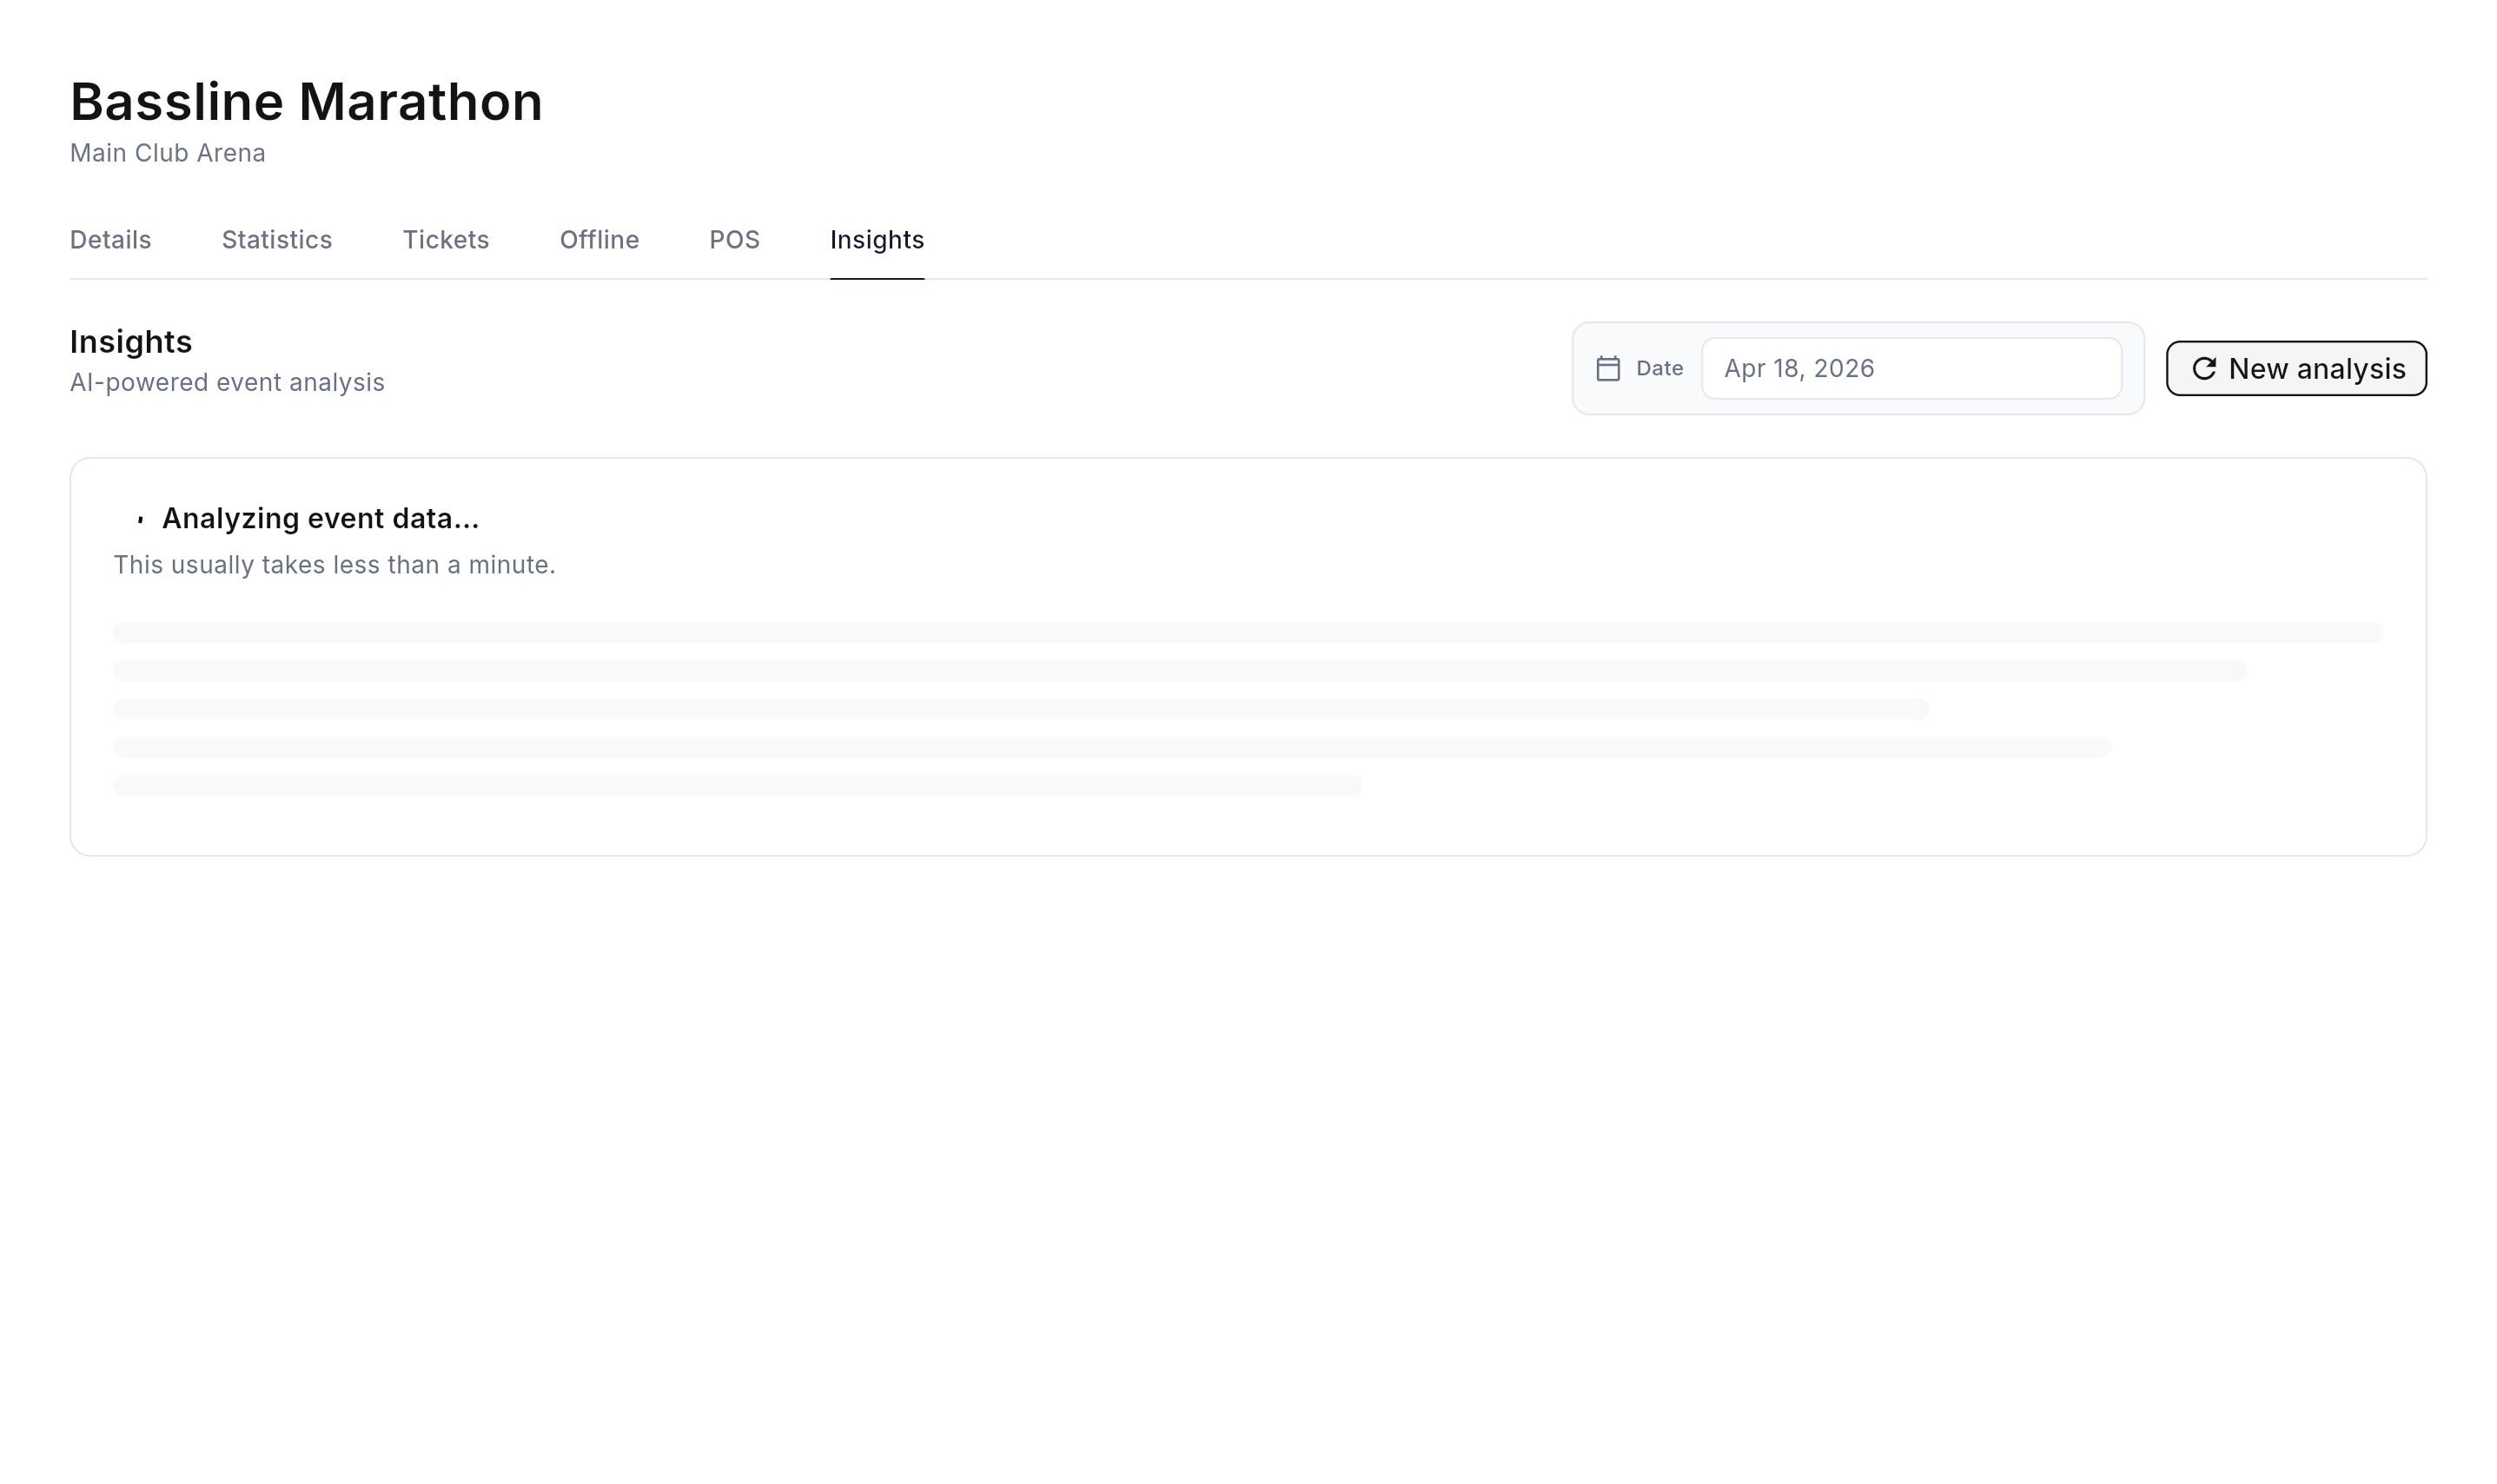
Generation runs in the background. The tab shows Analyzing event data… and usually finishes in under a minute.
Stay on the page until the briefing appears. If something goes wrong, refresh the tab and try again.
Preview
Read the briefing
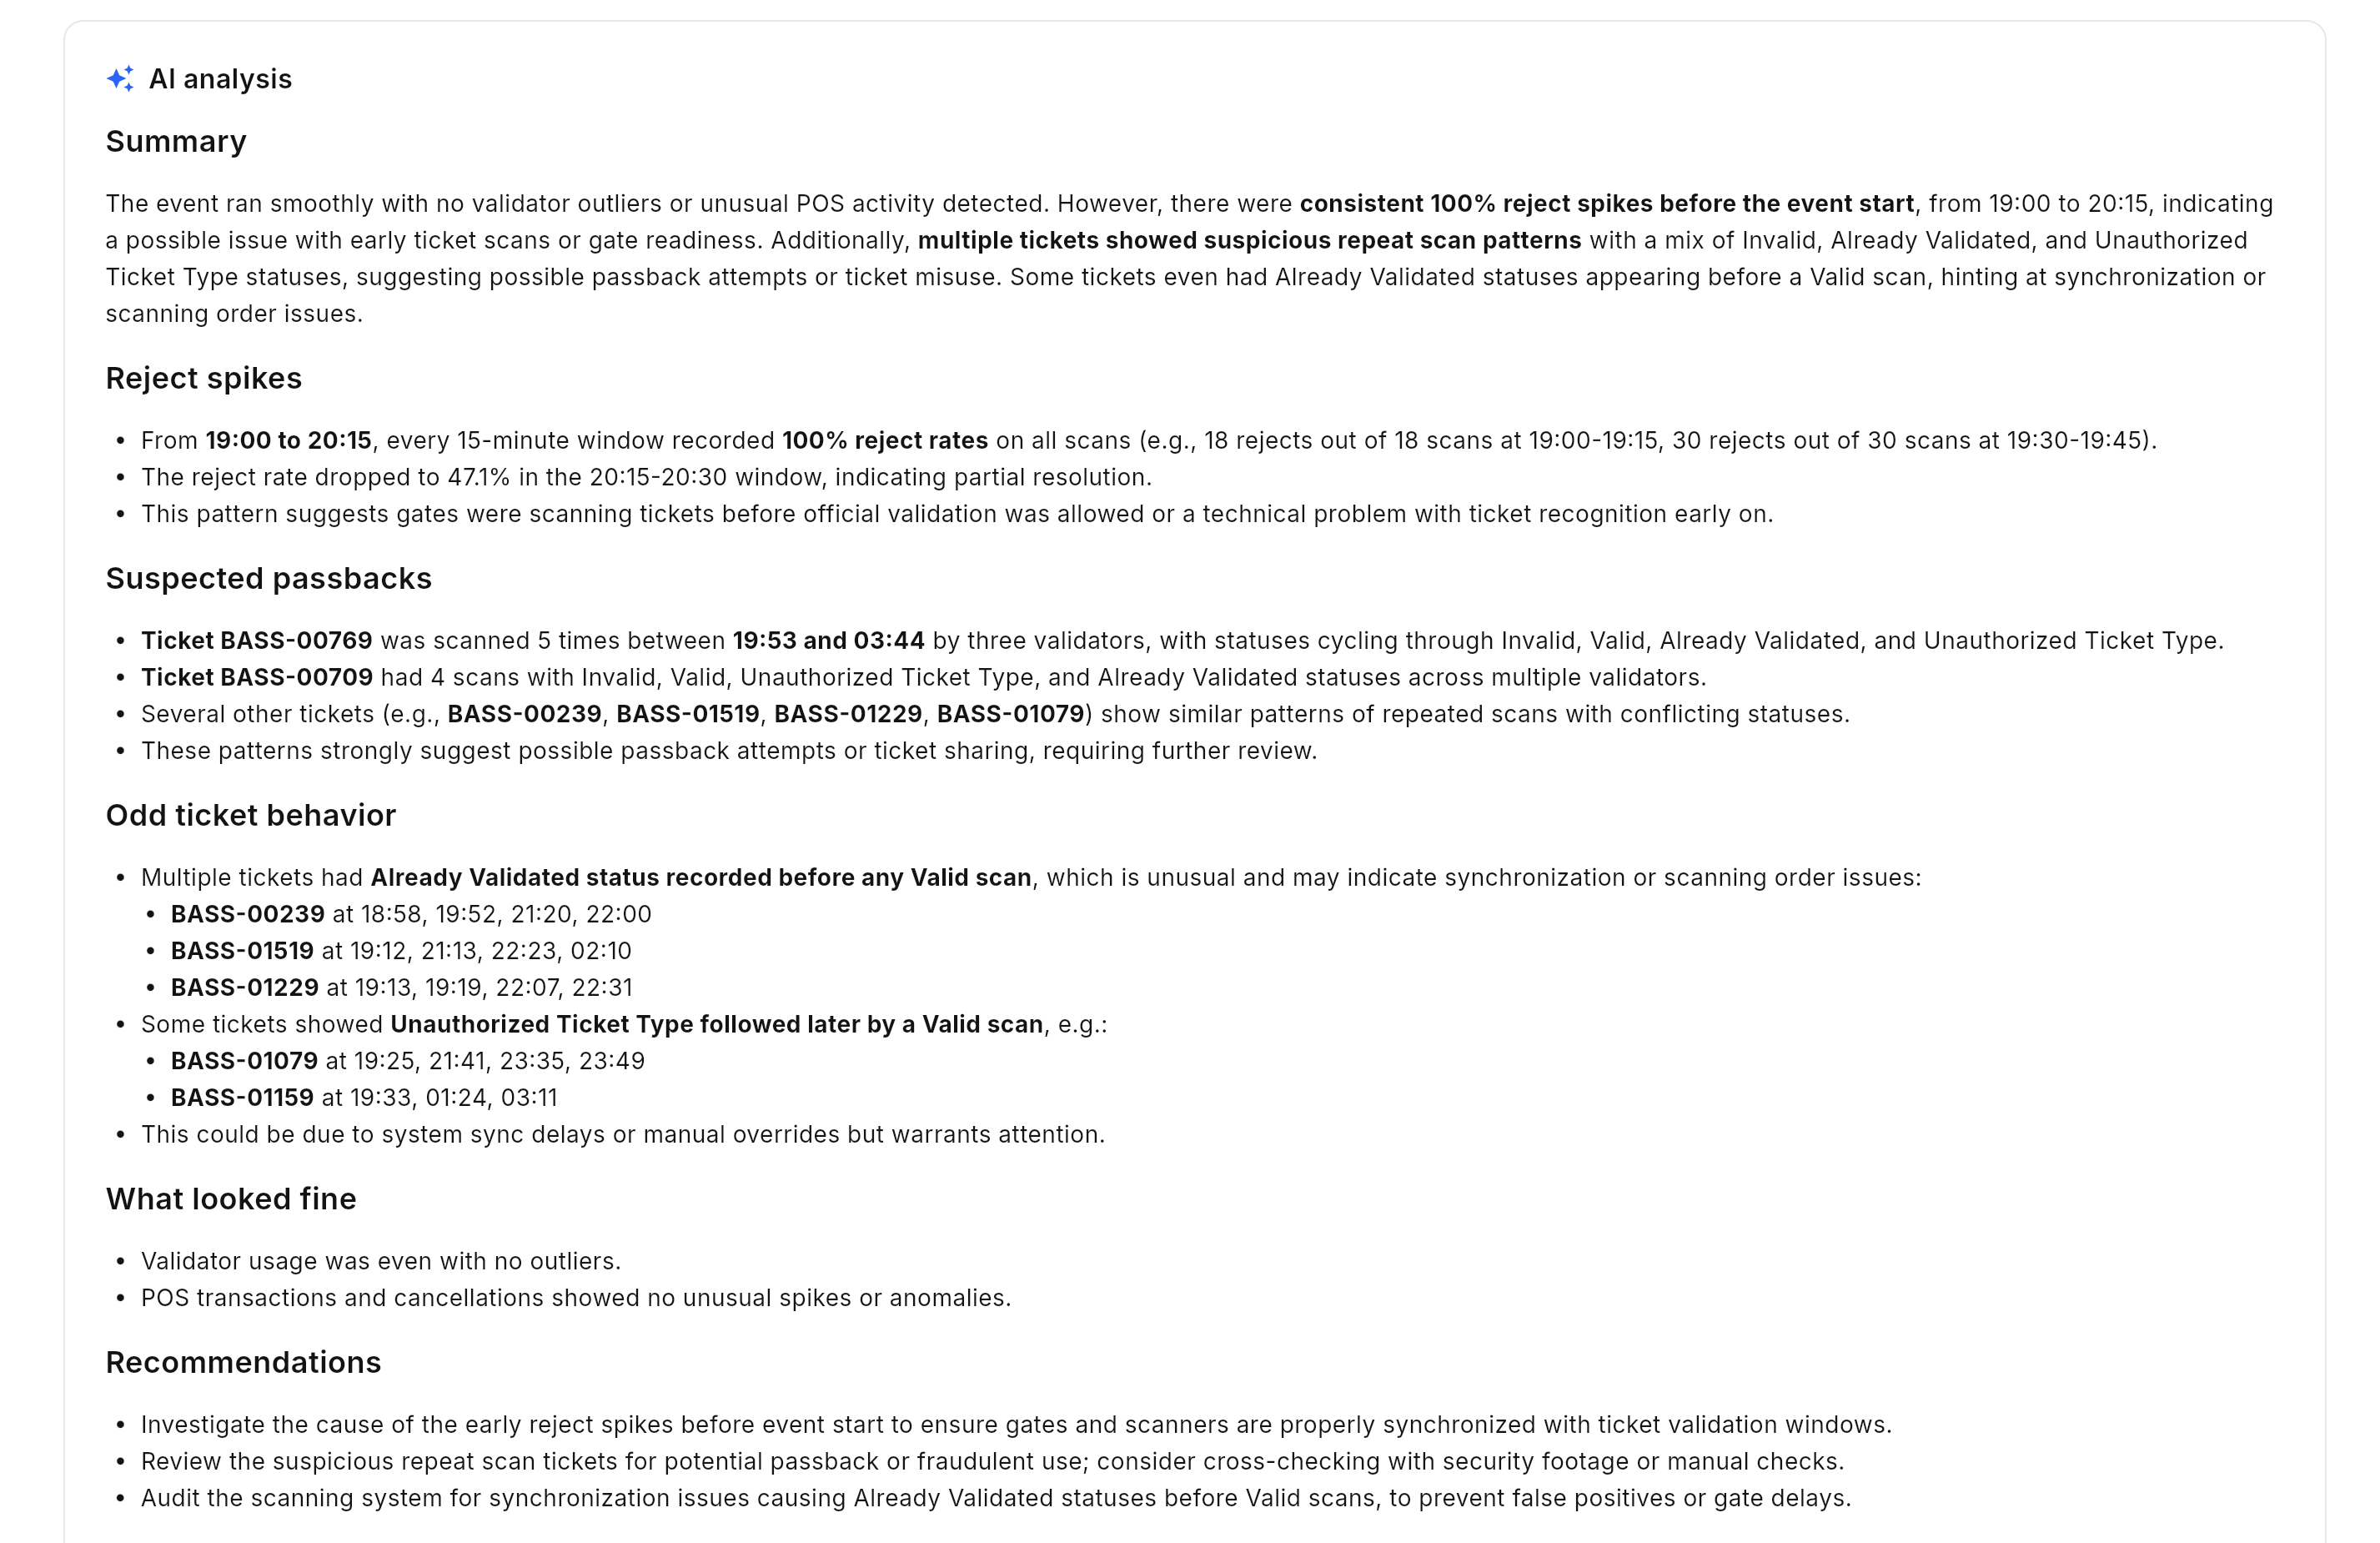
When ready, Insights shows an AI analysis report. The auto-generated summary is written for busy venue managers and stays signal-led:
- Starts with a short Summary (including a brief all-clear note when things looked fine).
- Adds sections only when warranted, for example suspected passbacks, odd ticket behavior, validator outliers, reject spikes, or POS oddities.
- May end with Recommendations when something unusual needs action.
Charts, live rates, and the full KPI layout stay on the Statistics tab. The report is meant to highlight what stood out, not to replace that dashboard view.
Preview
Ask a follow-up
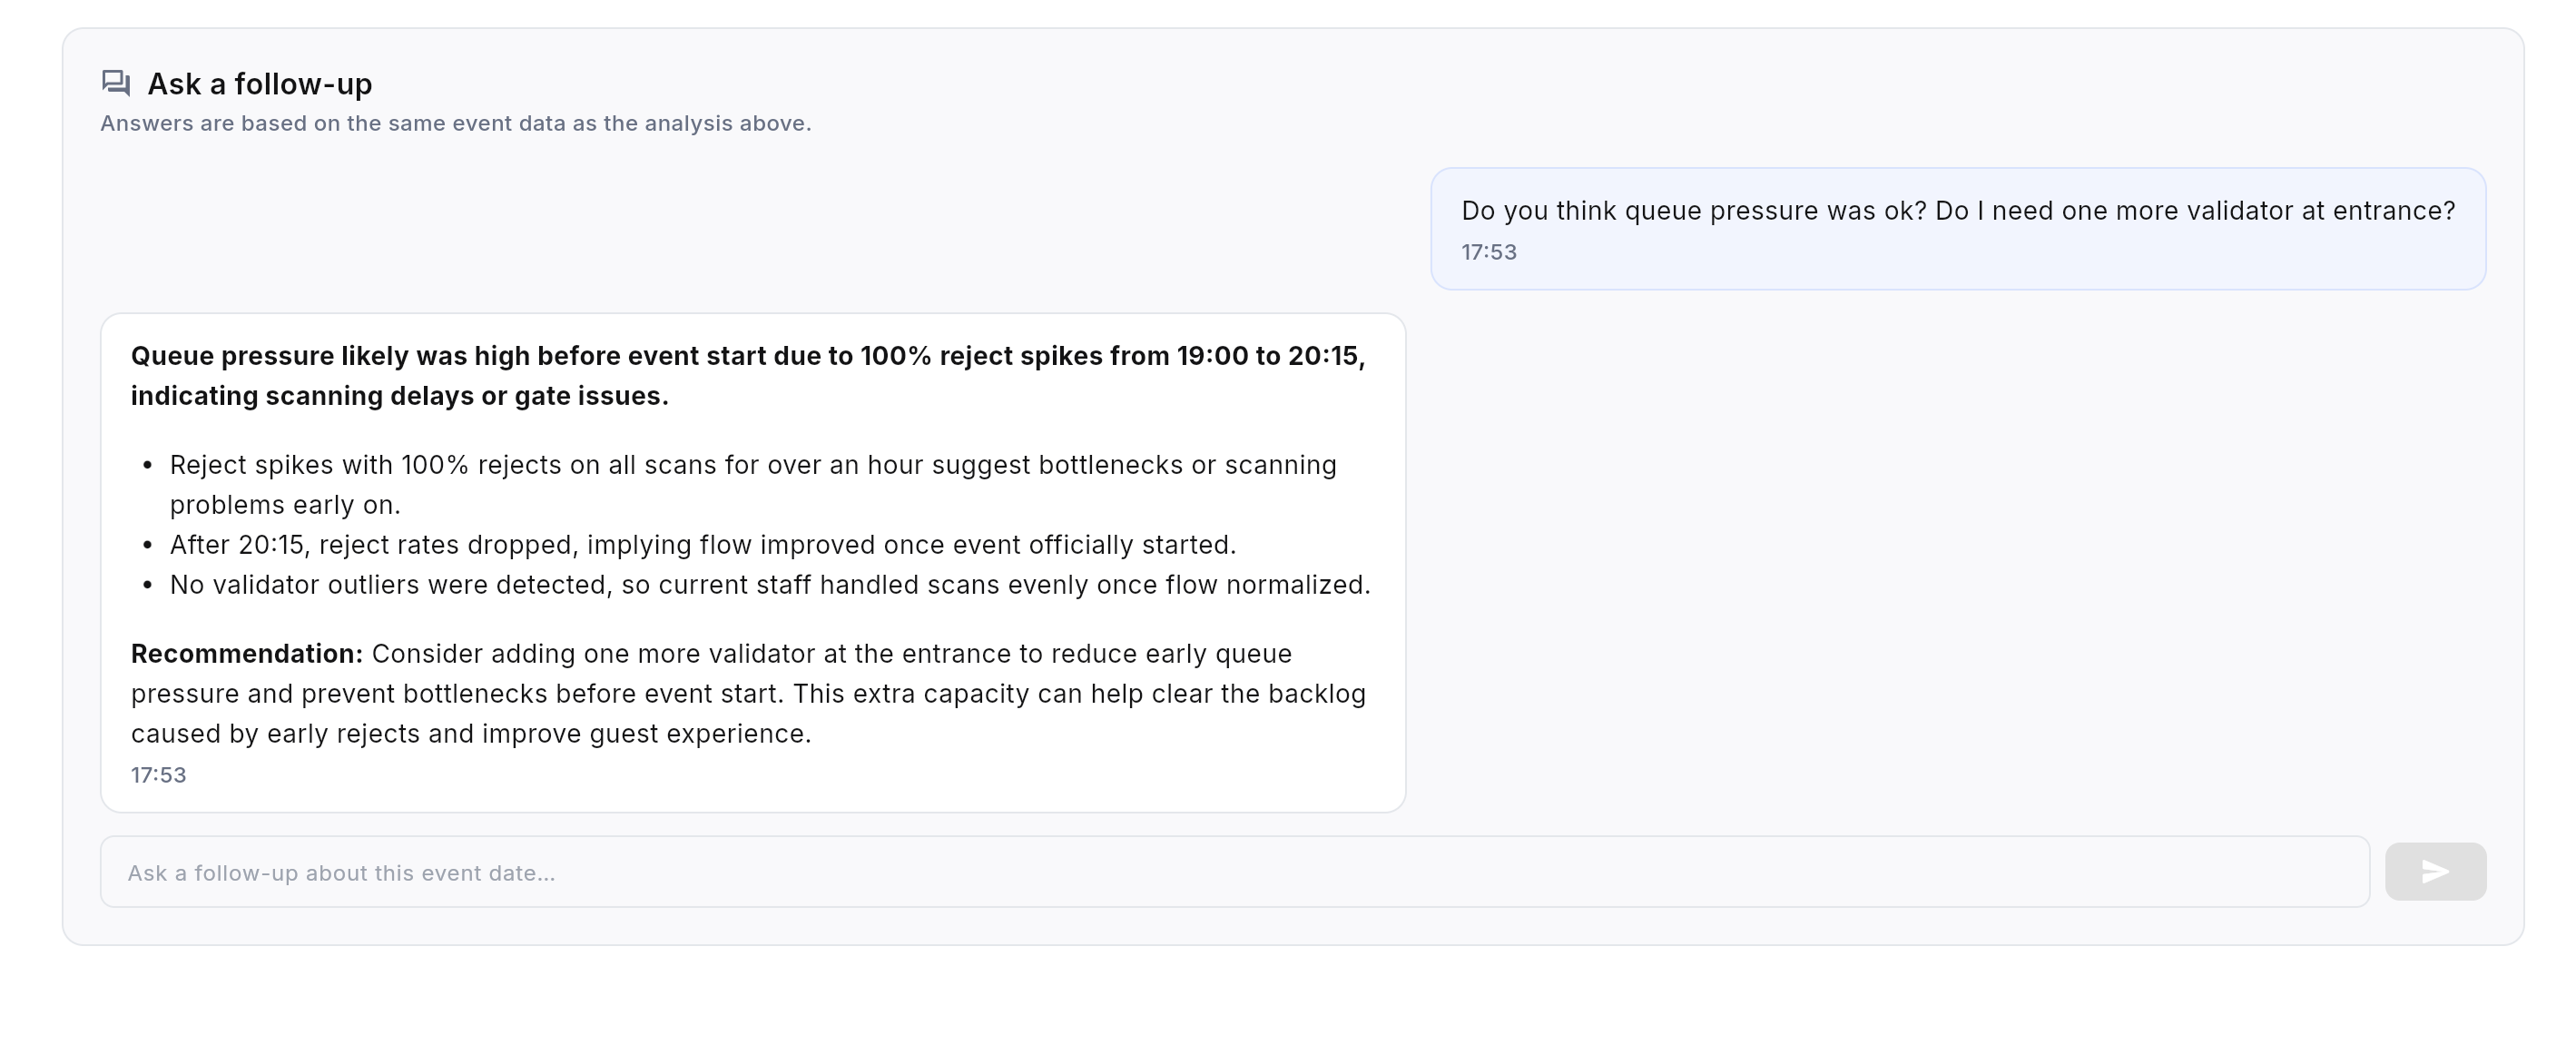
Below the report, use Ask a follow-up. You can ask about anything related to that event date: unusual patterns, attendance, scan rates, validators, ticket types, POS, timelines, and more. Answers stay grounded in the same event data.
Type free-form questions in the composer (hint: Ask a follow-up about this event date…). Examples:
- How was attendance and attendance rate for this date?
- Do you think queue pressure was OK? Do I need one more validator?
- Which tickets look like possible passbacks or repeat scans?
- Which validators had unusual reject rates?
- Anything odd in POS activity for this date?
Only the person who owns that analysis conversation can continue the chat on it.
Preview
- Statistics: live and historical KPIs, charts, ticket-type performance, validator tables, and raw logs. Ideal when you want the full visual dashboard.
- Insights: a generated briefing that focuses on what stood out, plus follow-up chat where you can dig into signals or ask for numbers and operational questions in plain language.
They share the same event-date scope and work well side by side.
- AI must be enabled for your account environment; if it is turned off, generation will fail until support re-enables it.
- Usage is rate-limited (daily analyses, chat messages, message length, and concurrent pending jobs). If you hit a limit, wait and retry later.
- Treat passback or fraud language as suspected signals to investigate, not proof.
- Viewers cannot generate; share conclusions from an admin session when partners need the findings.
- Locked card: sign in as an Administrator, or ask one to run the analysis.
- Empty / all-clear report: little unusual activity for that date. Confirm the date and that scanners recorded data.
- Generation stuck or errors: refresh the tab; if AI is temporarily unavailable, try again shortly.
- Cannot continue someone else’s chat: only the conversation owner can send follow-ups on that analysis.
Ask what you need to know
Open Insights, pick the event date, generate an analysis, then ask follow-ups about signals, stats, or operations. Use Statistics when you want the full charts and KPI layout, and manager mobile for live monitoring on the floor.